In marketing we often deal with groups because it is less resource intensive than trying to have a separate strategy for every customer. Like a Pokemon battle we look to win with customers based on our own special powers, except we might refer to these as competitive advantage.
Sound strategic decisions require understanding our customer segments so we can maximize our chances of success in the market. We do this by appealing to values, beliefs, or preferences with the target segment.
Let’s explore how we can use Chi Square tests and Mosaic plots to understand our customers buying preferences in order to inform a campaign strategy.
Scenario
Let’s suppose we are in the business of selling plush Pokemon dolls in an online store and our goal is to maximize sales by sending out a segmented email for a 20% discount. Since people are likely ignore the email, we need to make sure the header mentions the Pokemon power most likely to lead to a click.
Data Required
We need a list of customers that includes a segment and the corresponding survey responses for each customer.
Results
The choice of email headers should be Segment1: Fire, Segment 3: Electric, Segments 2 and 4 Psychic.
Follow along below in R Studio to see how we arrived at this result.
Simulate Data
First let’s simulate some data based on four known customer segments where each customer has responded to a survey telling us what their favorite Pokemon power is. Each row represents one customer.
A preliminary step in segment analysis is looking at the cross tabulation of our categories, in this case segments and favourite powers. The xtabs function is a good friend for counts, and we can follow-up with prop.table to view percentages.
> PokeTabs
          Segment
Powers     Segment1 Segment2 Segment3 Segment4
  Electric       11       38       30       17
  Fire           77       63       10       16
  Psychic        25       65       14       45
  Water          37       34       16       22
> round(prop.table(PokeTabs),2)
          Segment
Powers     Segment1 Segment2 Segment3 Segment4
  Electric     0.02     0.07     0.06     0.03
  Fire         0.15     0.12     0.02     0.03
  Psychic      0.05     0.12     0.03     0.09
  Water        0.07     0.07     0.03     0.04
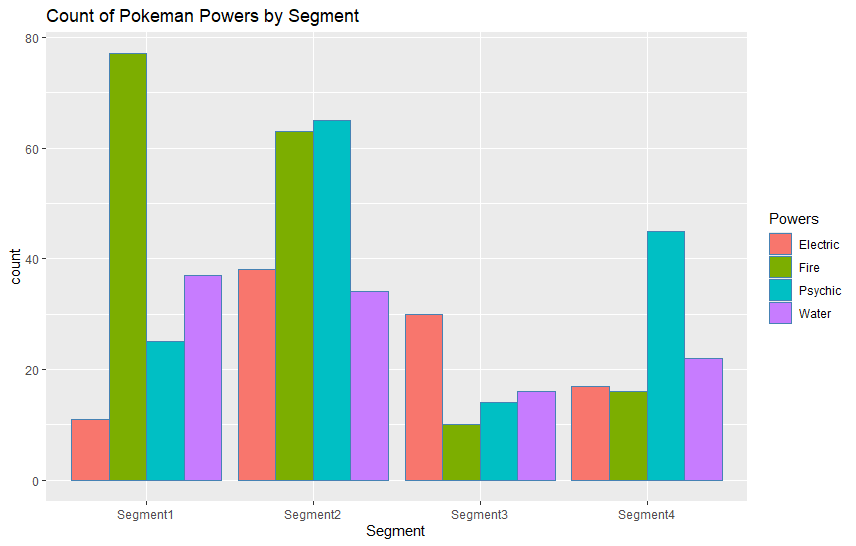
To get a better view of our customer preference counts we can rely on the ggplot package for a simple barplot.
### Bar Plots
ggplot(SampleDF) + geom_bar(aes(x = Segment, fill = as.factor(Powers)),
                            position = "dodge", stat = "count", col="steelblue") +
                            labs(title = "Count of Pokeman Powers by Segment",
                                 fill = "Powers")
Chi Square Test
The idea behind a Chi Square test is that if the categories are independently distributed (i.e. random) then membership should match the proportions. Chi Square will alert us if certain category combinations appear to be overly saturated given the size of the groups.
Running a Chi Square test in R is very simple, we just pass in the table of counts created by xtabs and R will tell us if these categories are distributed evenly across groups, or alternatively, if there is a relationship between them.
We will also ask our test to simulate a p-value since simulations are always fun.
### Xi Square Test
chisq.test(PokeTabs, simulate.p.value = T)
	Pearson's Chi-squared test with simulated p-value (based on 2000 replicates)

data:  PokeTabs
X-squared = 87.613, df = NA, p-value = 0.0004998
Our results are statistically significant (p-value < 0.05 by convention), which is great, but this unfortunately doesn’t tell us which groups to focus on.
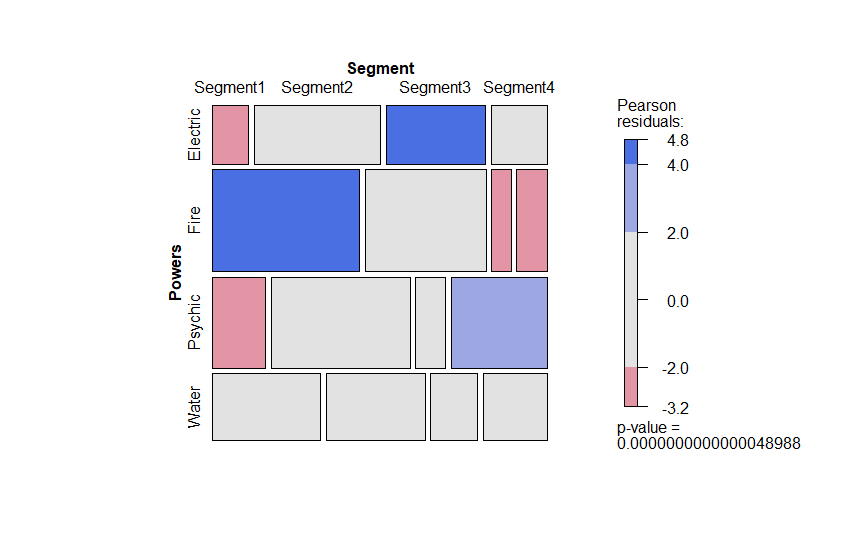
Mosaic Plots (VCD)
The VCD package in R provides an easy to use mosaic plot that helps detect significant differences between categories. This is similar to a categorical heat map that will assist us in focusing our strategy.
Looking at the mosaic plot we can tell from the blue areas that Segment3 prefers electric, Segment 1 prefers Fire, and Segment 4 has a moderate preference for Psychic. It looks like Segment 1 and Segment2 may have a slight preference for Water, but in general Water preference is too close to call.
Conversely, the red areas tell us which powers do not resonate with certain segments. Segment1 is not a fan of Psychic Pokemon, and Segment1 does not like Electric, as examples.
The choice of email headers should be Segment1: Fire, Segment 3: Electric, Segment4 Psychic. Given that Segment2 has no clear preference but appears to lean toward Psychic, we can combine it with Segment4 for this campaign.
Conclusion
Chi Square Tests and Mosaic plots can assist in understanding our customer and support strategic marketing decisions or help our campaigns stand out from the noise.
These simple techniques can be extended to multiple categories and form the basis for optimizing price or promotional spend, a topic that may form the basis of a future post!
References
Chapman, C; McDonnell Feit, E. R for Marketing Research and Analytics. Springer, 2013.